Sage Data & Analytics — Smart BI for Sage 100
Business intelligence (BI) software has a reputation for being expensive to purchase and complex to use — which has kept many small and mid-sized companies from pursuing it. That’s unfortunate, as business intelligence is critical for companies of all sizes — providing visibility into trends and opportunities and helping to fuel better and faster decision making. Earlier this year, we introduced you to Sage Data & Analytics, a powerful business reporting application just released for Sage 100 users. We promised to follow up and provide additional details on the BI solution — including what makes it an ideal fit for small and mid-sized organizations like yours. Read on for further insight. You can also view this recorded webinar at your convenience.
What is Sage Data & Analytics?
Sage Data & Analytics is a new BI tool for Sage 100. While it’s new to Sage 100, it’s been proving itself among Sage X3 users for years. The solution is powered by Zap BI and configured and optimized specifically for Sage 100. Because it’s a business reporting solution designed to work with Sage 100, you’ll have broad functionality right out of the box. Pre-built industry analytics, KPIs, and calculations accessed through role-based dashboards deliver immediate insight into your Sage 100 data.
What are the benefits?
- Combine data sources
We understand that it takes many business applications to run a business — each one the receptacle of valuable data. Sage Data & Analytics allows you to combine data from multiple applications into meaningful, cross-function reports. The solution includes over 100 connectors for other data sources including ERP, CRM, financial systems, HRM, marketing tools, databases, files, and more. - Personalized dashboards
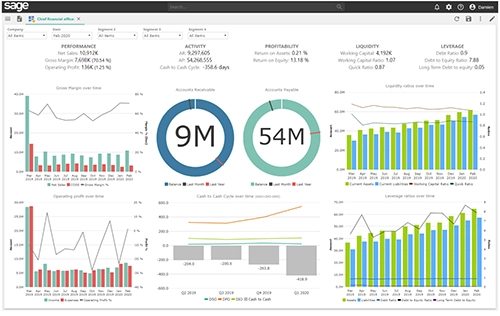
Dashboards are an ideal way to present even complex data in clear, visual snapshots. With Sage Data & Analytics, your team can quickly analyze data in personalized dashboards. Each user sees just the information that’s relevant to their role and tasks. The inclusion of pre-configured dashboards will get you started, and you can modify and create new ones that fit your operation. - Speed migration off legacy platforms
Many companies continue to maintain and update legacy applications since those applications contain valuable business history. Using Sage Data & Analytics, you can gradually migrate to Sage 100 from one or more legacy systems without losing insight into historical data. Combine the historic data from other applications with your current Sage 100 data for a complete data timeline using a single reporting tool.
Business intelligence and reporting tools help companies gain deep insight into their operations that might otherwise be missed. By combining disparate data sources and presenting the data in personalized reports and dashboards, Sage Data & Analytics helps you make better, more informed business decisions in less time. View the recorded webinar here or contact us for more information on Sage Data & Analytics.